S&P 500: What is the outlook on stock buybacks in 2023?
Admin August 30, 2023.
J.P. Morgan analysts believe the outlook for share buybacks in 2023 is "dimming." Yahoo Finance Markets Reporter Jared Blikre outlines U.S. stock buyback expectations for the remainder of 2023 while examining headwinds bearing down on the S&P 500's daily gains expectations for August, market outlooks, and pricing trends surrounding bitcoin.
Video Transcript
RACHELLE AKUFFO: The S&P 500 hasn't managed back-to-back gains in August. It's set to break a 22-year record. For more on what could fuel the market higher, including share buybacks, let's go to Jared Blikre at the New York Stock Exchange. Hey, Jared.
JARED BLIKRE: Hi. Rachelle. August has been a little bit of a disappointment for equities. Although, we knew coming into the month that August is seasonally weak. So more on that in a second.
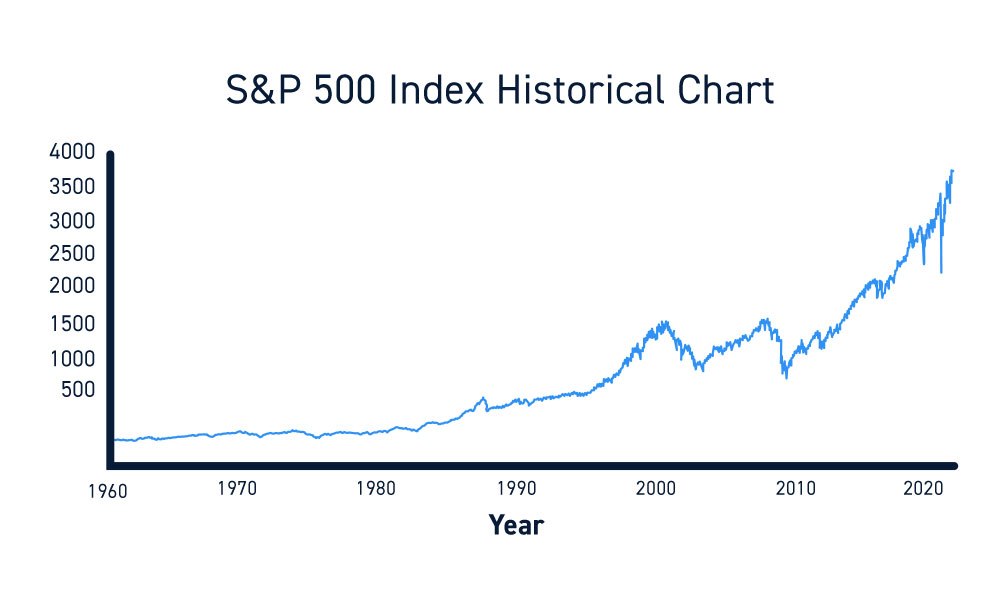
I want to go to the YFi Interactive. You mentioned buybacks. And that is a perennial source of a potential tailwind for the markets. Here, we have buybacks going all the way back to 2007. And we are tracking actually near record. I think we're at the second highest amount in the US versus history.
Here's a chart by JP Morgan showing that we are not quite at the levels we've seen in years past. But, again, we do have until the end of the year. And so let me just bring up some cautionary words from the JP Morgan team talking about buybacks.
Just waiting for this to come. Here we go. They see a dimming outlook for buybacks. Corporate sentiment around them has already turned less positive, given limited earnings growth, much richer valuation, and the IRA buybacks tax despite strong buyback activity year-to-date. And this is the second highest on record.
This relatively strong activity is less productive in reducing share count, given the inflated prices and valuation. So to say that we've had this incredible rally this year and a lot of the growth stocks, but that is diminished. That is increasing the valuations and diminishing the effects of these buybacks.
I want to go back. I'm going to show another chart now. You mentioned that we have not had back-to-back days in the S&P 500. And here is a chart of the daily wins and losses going back to about March of this year. You can see some elevated volatility around the internet banking crisis back then. But not two days consecutive in the month of August, except to the downside. We got a couple of streaks there.
All of this coming on the seasonality that we see in the third presidential year. This has to do with Ryan Dietrich's chart that I like to show quite a bit. We are right here now somewhere in August. And we just tend to go sideways into November. So we have to see if that becomes true.
But in the meantime, we do have a little bit of a headwind for the uber bulls and probably the uber bears too. Frustration on both sides.
BRAD SMITH: Jared, how has August been for some of the riskier assets out there? And say, we throw cryptocurrency out there and Bitcoin.
JARED BLIKRE: Yes. The riskier assets, the fringier assets, you can throw crypto in there. You can throw meme stocks. Those have fallen off. Those have given back some of those gains that we saw earlier in the year.
If we go back to the YFi Interactive there, thank you for that. Here, we have Bitcoin. It's just barely positive from yesterday. But let me go back. Let me just show a three-month chart, and we can see what's happened. We did fall out of bed here. We broke the 30,000 level. That didn't seem to break the bank. 28,000 29,000, it was a quick trip down after that.
And if we look at the year-to-date chart, we have only come down to what is probably just another support level. And all of this just looks like an extreme case of the sideways going all the way back to April. So really, not a lot has changed in the cryptocurrency front, if you just look at this Bitcoin chart.
Although, we do have some developments on the court side and everything else. It's going to be difficult to think what the ultimate catalyst will be, either the Fed increases liquidity. And you can bet this chart will go to the moon, if and when the Fed finally does cut. But that could be years away. Or we have another big event like a halvening. Or to the downside, we got the Binance. Anything that happens with Binance and a huge regulatory crackdown on them could also bring lower prices.
RACHELLE AKUFFO: And Jared, just quickly, in terms of seasonality, because we know that August does tend to be a dismal month. But when you wrap in things like, China trying to be propped up, more hawkish tone from Fed Chair Jay Powell. What should we really make for investors in terms of the mindset when we think about August?
JARED BLIKRE: Well, I think, in general, we need to be on a little bit of defense here. We're wrapping up the summer. There's not a lot of liquidity. The floor here is pretty quiet admittedly in the month of August. And then when we think about what happens in the fall, back to school, suddenly, people's minds get in their head that they are back to business. That is a return of liquidity to the market. And that's when actual decisions have been made.
I think the entire summer was basically on autopilot. There was an upper goal reached in the NASDAQ and the S&P 500. Profits were taken. There was no huge directional change in monetary policy or anything coming out of the central banks. We didn't really have a lot of surprises. Things went pretty well with the economy.
And if anything, low expectations were beat. So for the month of August, I think we're going to consign that one to the history books of not having much happen. And we're probably just going to be looking ahead to September, October.
If we look back at that chart with just one more time here, we can go to the YFi Interactive. It doesn't look like I'm able to control this now. So I'm not sure what you're seeing on your screen. But I was just going to show you that sideways pattern tends to continue into September and October. That's when we see volatility spike historically in the stock market. That's when we have market crashes.
Most years, September and October is good. But, occasionally, you get a crash. For whatever reason, we've had a lot of those historically in this time of year. So that accounts for those VIX seasonality charts that you see that go just like this towards the end of the year.
BRAD SMITH: All right. Thanks so much, Jared. Down there at the New York Stock Exchange. Appreciate it.